

How to open the page
- From the sidebar: click Metrics. The page opens with all your campaigns.
- From a campaign: these shortcuts take you to the page, opened straight on that campaign:
- The View metrics icon on the campaign in the campaigns list.
- The Review results button that appears after you send a campaign.
- The metrics icon in the flow editor.
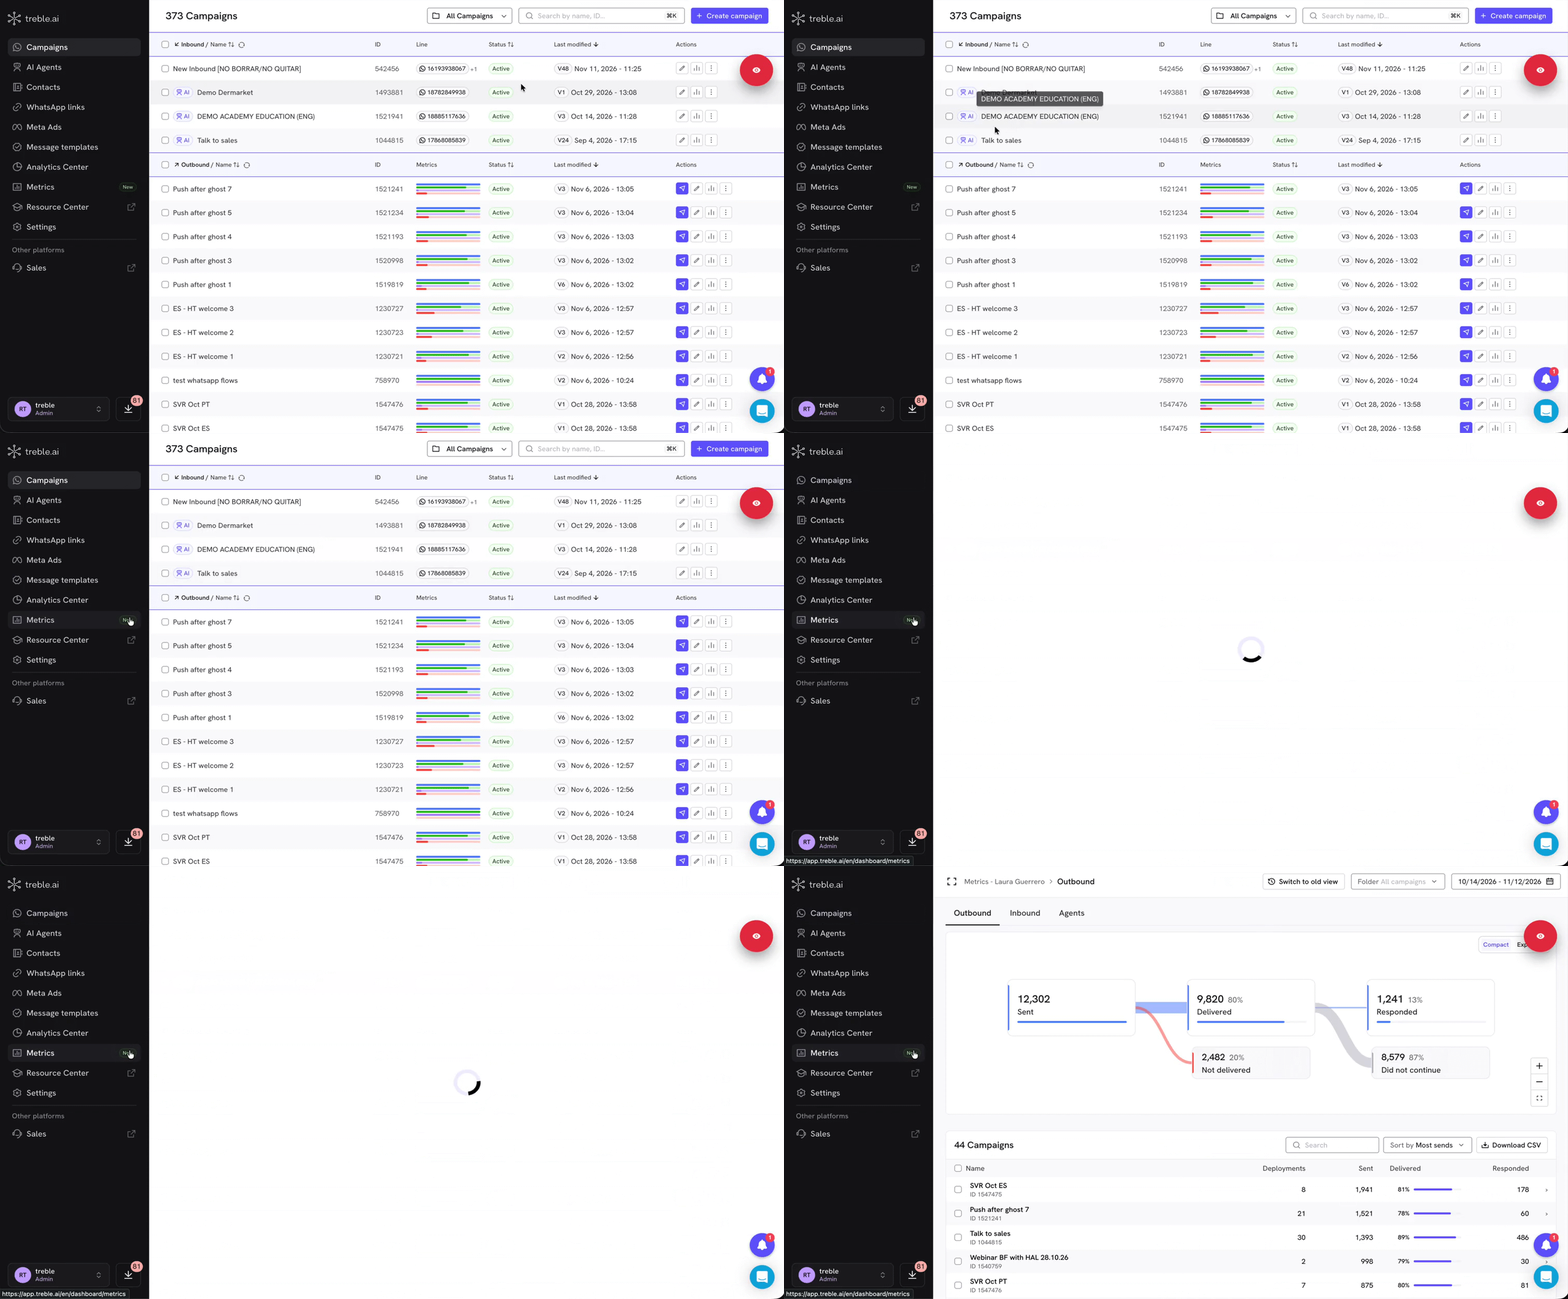
The three tabs
Outbound
Your outbound campaigns: how many messages were delivered, how many contacts replied, and where in the flow they stopped.
Inbound
The conversations your contacts start: where they come from and how they end.
Agents
Your team’s work: availability, first reply times, transfers and ratings.
Filters
Date range
At the top you pick the period you want to analyze:- Last 7 days
- Last 30 days (the range the page opens with)
- Last 90 days
- This month
- A custom range: pick the start and end day in the calendar and click Apply.
Folder and campaigns
In the Outbound overview you can narrow what you see:- Folder: shows only the campaigns in one folder.
- Campaign selection: tick the box of several campaigns in the list and click View metrics to see their numbers together in the graph. To see all of them again, clear the selection and click Show all campaigns.
How to move around the page
- Breadcrumb: at the top you see where you are (for example, Metrics › Campaign › Deployment). Click any level to go back to it. The back arrow and your browser’s Back button also take you one level up.
- Graph cards: click a card to see, in a side panel, the contacts or conversations it counts.
- Info icon : hover over a graph card or a column title to see what each number counts.
- Full screen: the button at the top left hides the sidebar and gives the page more room. The graph has its own full screen button, in its bottom right corner.
Downloads
- Graph: open the graph in its full screen and click Download to save it as PNG or PDF.
- Tables: Download CSV gives you the table’s data with the filters you have applied.
- In Outbound, the file downloads right away, with up to 50,000 rows.
- In Inbound and Agents, the report is generated in the background and is ready in the download center.
Key concepts
These terms appear across the page:How is it different from Treble’s other metrics?
Analytics Center
: gives you the raw data tables (sessions and deployments) so you can build your own analysis. Metrics already shows you the calculated results.sales.treble.ai metrics
: the agent platform’s dashboard. Some metrics, like first reply time and time to close, are calculated differently from the Agents tab, so the numbers may not match. We explain it inAgents
.
Next steps
Outbound
Understand your campaigns’ journey, from the send to the conversation.
Inbound
Find out where your contacts come from and how their conversations end.
Agents
Measure your team’s availability and reply times.