

Metrics
shows how your team handles the conversations that reach it from Treble: how many agents are available, how long they take to reply, which conversations are still waiting, and how your customers rate them.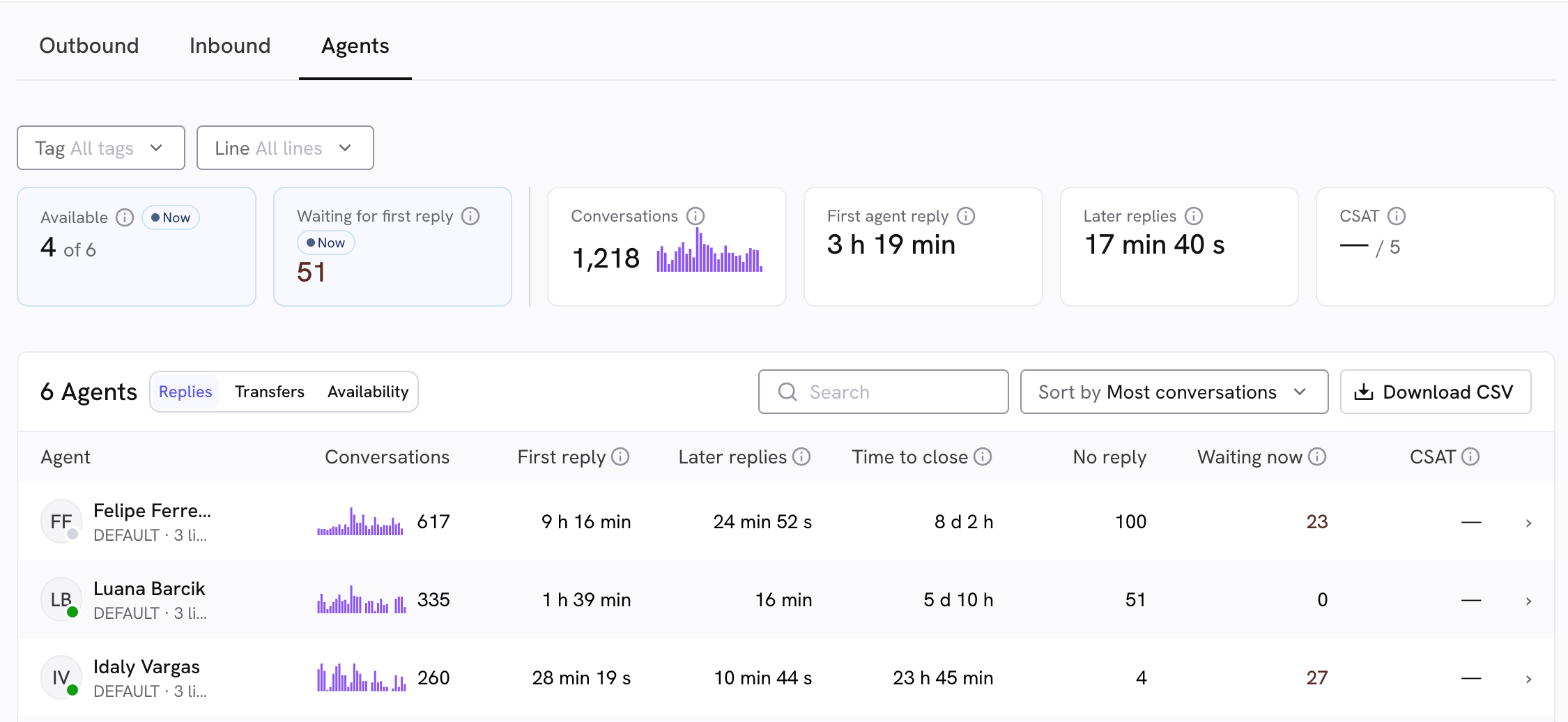
Filters
- Date range: the tab counts the conversations that were created within the range.
- Team, Tag and Line: narrow every number in the tab. You can combine them. If your company has only one option in any of them (for example, a single line), that filter doesn’t show up.
Cards with the Now label show the current moment: the date filter doesn’t change them.
Team summary
At the top you’ll find these cards:- Available (Now): how many agents have their status set to active right now, out of the agents in the list who have ever used the status switch. It isn’t a sign-in: the agent stays active until they, an admin or an automation set them to inactive.
- Waiting for first reply (Now): conversations assigned in the last 30 days that still have no message from the agent. It turns red when there are any.
- Conversations: the conversations with agents that started in the dates, including the ones that were never assigned, with a small chart per day.
- First agent reply: the median time from when the conversation is assigned to the agent until their first message. It leaves out the wait in the queue before the assignment.
- Later replies: the median, across conversations, of how long the contact waits for the agent’s next message after the first reply. AI messages don’t count as a reply.
- CSAT: the average of the 1 to 5 ratings your customers gave after the conversation closed. Only some conversations get a rating.
Agents table
Below the summary there’s one agent per row. To make sense of the numbers, keep two rules in mind:- Who shows up: agents with at least one conversation created in the range, or with a conversation waiting for a reply right now.
- Who each conversation counts for: the last agent who had it. If a conversation went from Ana to Luis, it counts for Luis.
- Replies
- Transfers
- Availability
- First reply: the agent’s median first reply, measured from assignment.
- Later replies: the agent’s median wait for their next message after the first reply.
- Time to close: the median time from when the conversation opens until it closes, only for conversations the agent replied to. It’s elapsed time, not the time the agent was actively handling it (AHT).
- No reply: conversations that closed without the agent replying.
- Waiting now: conversations assigned in the last 30 days that are still waiting for a reply. It turns red when there are any.
- CSAT: the agent’s average rating and, in brackets, how many ratings they got.
- Sort by: Most conversations, Slowest first reply, Most waiting now, Lowest CSAT, Most transferred out, Most transfers in, Least available, or Name.
- Search an agent by name.
- Download CSV: the report includes every agent in the range and filters, with all the columns, and is ready in the download center. Times come in seconds.
Agent detail
Click a row to see a single agent’s numbers. The back arrow takes you to the list without losing your filters. In the detail you’ll find:- The same cards as the summary, just for that agent, plus their Time to close and Transfers (out and in).
- Availability: one day per row, with a 24-hour strip, the time they went active (On), the last time they were set to inactive (Off), and their total active time. If the agent was active from midnight to midnight, you’ll see Never off: that time isn’t time worked.
-
Conversations: every conversation that counts for the agent, with the contact, the source and line, the assignment time, the first reply, the time to close, the rating, and its status:
- Closed: the agent replied and closed it.
- Closed with no reply: it closed without a reply from the agent.
- Open: the agent replied and it’s still open.
- Waiting for a reply: the agent hasn’t replied yet.
Busiest hours
At the end of the tab, a heatmap crosses the days of the week with the hours of the day. With Show you pick what each cell shows:- Conversations: how many conversations start in that hour, on average, on that day of the week.
- First reply: the median first reply of the conversations that started in that hour.
- Agents available: how many agents were active on average in that hour, not counting the days they were never set to inactive.
How availability is measured
Availability comes from the active / inactive status each agent sets in sales.treble.ai. It isn’t a sign-in record: if an agent leaves without setting themselves to inactive, they keep counting as available.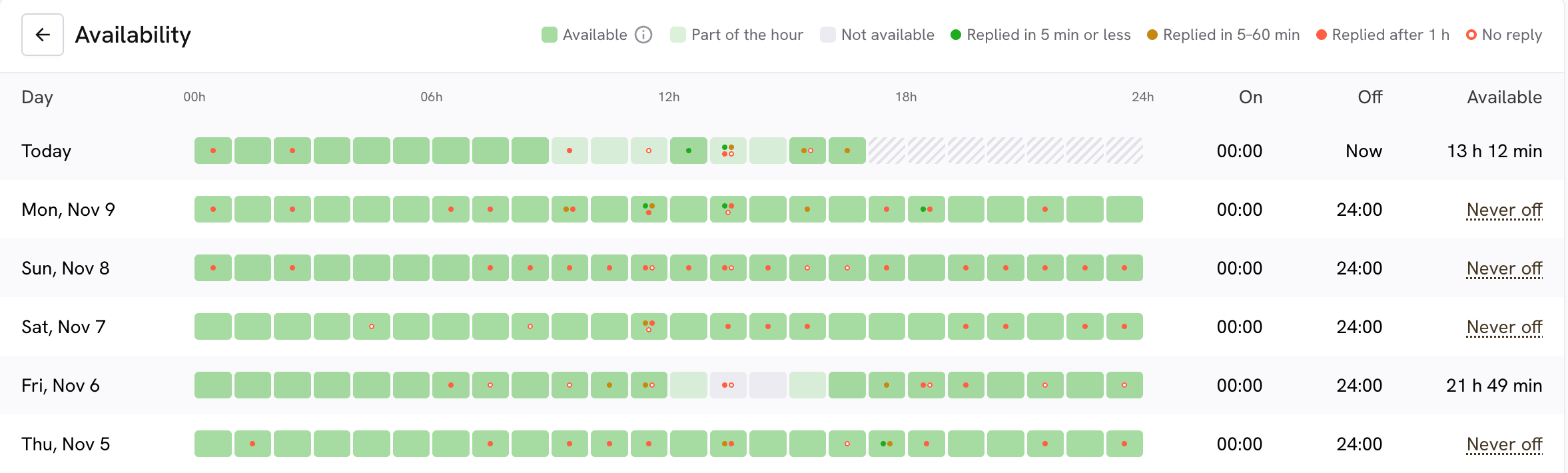
- Cell color: dark green if the agent was active the whole hour, light green if they were active part of the hour, and grey if they weren’t available.
- Dots inside the cell: one per conversation that started in that hour, based on how long the first reply took:
- Green: replied in 5 minutes or less.
- Yellow: replied in 5 to 60 minutes.
- Red: replied after 1 hour.
- White with a red border: no reply yet.
Differences from the sales.treble.ai metrics
Thesales.treble.ai metrics
and this tab measure similar things, but not always the same way. That’s why the numbers may not match:Next steps
Inactivity detection
Automatically set agents who stop replying to inactive.
Inbound
See how the conversations your contacts start end up.